A solution concept diagram for evaluating a SaaS

archimate image for cover page of articleSomeone asked me to show a type of diagram I’ve been using to quickly assess the architecture for a solution. The following diagram is one I’ve been using and it seems to work for me. However, let me make a few qualifications on this diagram and its use. The diagram can be found at the end of this post.

  1. My primary use of this diagram has been where I’m diagramming a proposed solution for procurement of SaaS. Because of this, I needed a diagram to quickly map the following:
    1. Functions of the SaaS
    2. Actors and/or roles using the functionality
    3. Logical data entities accessed by the functionality
  2. While gathering this information from the business line, I’d then derive the following:
    1. The interface between actors and the functionality
  3. I’ve kept functionality at a business level although I believe you could capture functionality at an application level. However, since I’m using this diagram as an initial capture of dependencies, I’ve kept it high level and focused on business processes.
  4. I’ve used Archimate as the notation because I’m integrating this information into a larger model of the enterprise.
  5. I’ve used ‘location’ in a somewhat unorthodox (but acceptable) manner. Location is not referring to a specific geographic location but more of a logical location (e.g., vendor site, satellite office, etc.) If I were to be more consistent, I’d assign all actors to locations, but I usually don’t need to in the analysis I’ve done.

I use this as a solution concept diagram with the idea of then building out supporting diagrams for these components. So what does this diagram give me?

  1. An easy to follow diagram whereby the business line can tell me that I’ve covered essential functionality of the solution or service.
  2. An easy way to identify key interfaces that the solution would require.
  3. Location allows me to segregate solutions.
  4. An easy way to capture and communicate data security level classification needs of the solution to our security team (at least as a first pass).

If I need to go into more detail on the mapping of the dependencies, this diagram still provides a launching point for this. The supporting diagrams I’d create would be the applications and systems that the business processes use. They could also show the applications or systems that are required to instantiate the interfaces.

So, in conclusion, this diagram would be advantageous if you needed to quickly do a number of surveys of business lines to capture what business functions solutions meet, the actors, and the basics on how interaction occurs. That would set the boundaries of what further detail needs to be mapped out.

This is a work in progress, so I’m always eager to hear any general constructive criticism on how this approach might be improved or how useful you might find it. Just keep in mind the context in which I’m using it.

[UPDATE]

One of the things I like about Archimate is how it can prompt you on better ways to represent the work you’re doing. I’ve left the original diagram I created (warts and all) so you can see how my thoughts changed. What I disliked about the original diagram is that it left me saying that many of the business functions of the facility mgmt. group were located at the vendor’s location. This didn’t sound right. So the second diagram now represents a better picture of what’s going on. The vendor’s location is where we find an application component that has application functionality associated with it. This functionality would probably realize an application service that is used in a business process, but I’m not focused on that relationship for this diagram. Right now I’m just concerned with who is using this functionality and how. (In fact, the way I had the old diagram would have done the job I had for it…..being a sheet of paper I could use to discuss what the business lines are using and why, but still the new diagram will be useful in a larger context.

So this is the old diagram:

solution concept example

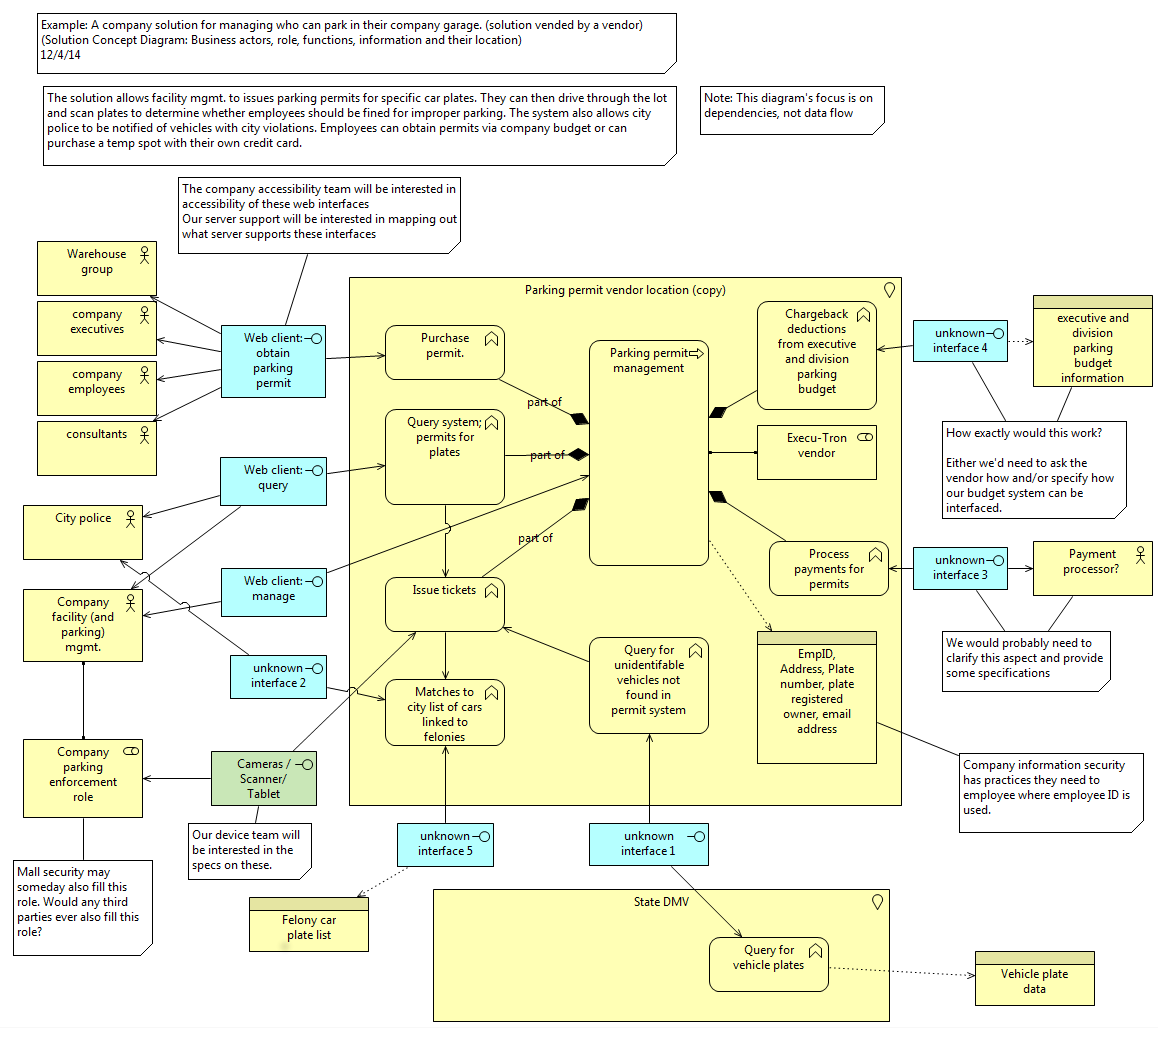
First pass at the diagram

And this is the new diagram (also including some clean up on roles and actors.

archimate diagram

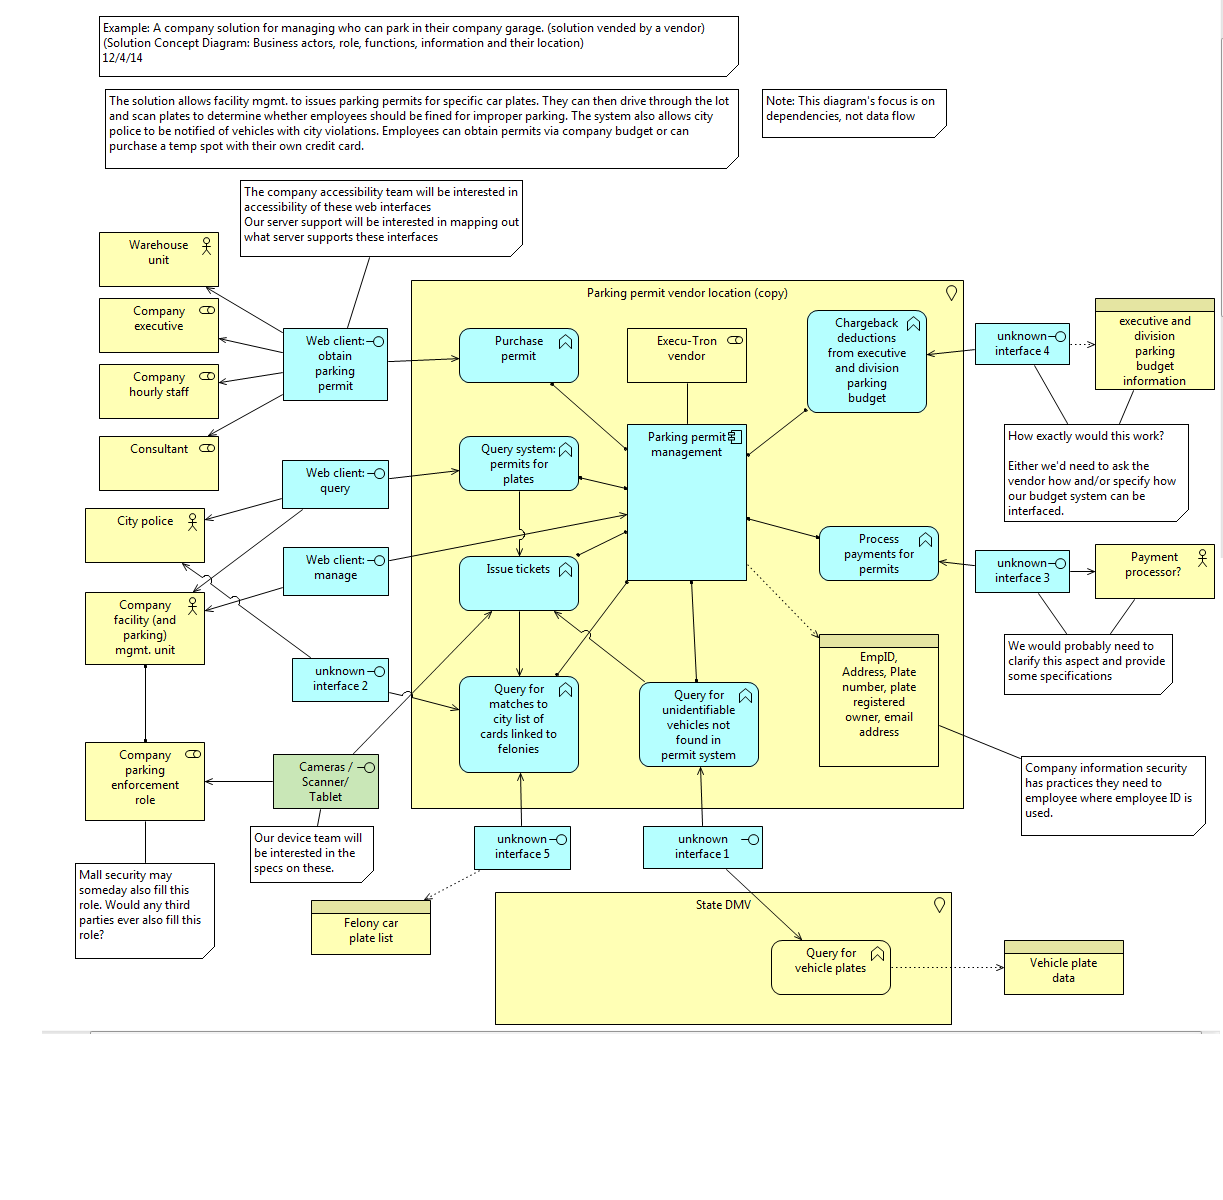
Second pass at the diagram

Looking for an analyst (primarily business and process)

drawWork is progressing in the EA Office here at MU. At this point I’m looking to hire an analyst.

The formal job description is listed below but here are the general aspects.

They would be working with our new EA modeling tool to help capture business processes and where technology supports those processes.

They would occasionally help with governance of some processes like review of architecture roadmaps and diagrams with various stakeholders.

To look at the job and apply:

1. go to http://hrs.missouri.edu/find-a-job/staff/index.php
2. click on “prospective employees”
3. search for either the title [BUSINESS TECHNOLOGY ANALYST] or the job id # which is 13957

Job Description

This position is responsible for the capturing of current architecture of the DoIT environment as well as aiding in the capture of target architectures, associated architectural requirements, DoIT architectural goals, principles and standards and other architecturally relevant information required for effective enterprise architecture. The BTA works with staff in the enterprise architect office to capture architecture information in the appropriate artifact or system as well as help oversee governance of this information. They must recognize when information provided may not be of an appropriate detail and escalate this issue to the enterprise architects or groups within the appropriate EA process.

Work with the enterprise architecture team, business analysts, solution architects, project managers, team leads and project sponsors to ensure that potential changes to business, systems and data, and technology architecture are appropriately captured, reviewed and governed. Duties include but are not limited to: capture of baseline and target architecture, capture of standards, enterprise architecture reviews and assessments, providing architectural input from the enterprise architecture repository to project charters and proposed operational changes.

Work with the enterprise architecture team and enterprise architecture governing committees to review and refine existing enterprise architecture procedures. Ensure that enterprise architecture artifacts meet the needs of DoIT and its stakeholders through periodic review.

Work with the enterprise architecture team to provide data curation to the enterprise repository – ensuring that baseline and target architectures, standards, and assessments are properly maintained over time and updated in a governed fashion.

Provide aid to DoIT staff in submitting or retrieving information to or from the enterprise architecture repository.

Provide formal and informal training on enterprise architecture policies and processes.

Hiring Range: $34,400 – $77,500

Shift: M-F, 8am – 5pm

Minimum Qualifications: Knowledge and experience normally acquired through, or equivalent to, the completion of a Bachelor’s degree and a minimum of 2 years of job-related experience in documenting policy, process or architecture in information technology.

Preferred Qualifications: Experience in one or more of the following areas is preferred: technical communication, data curation, information science, business analysis, architectural analysis. Familiarity with UML or Archimate modeling is desirable. Certification in one or more of the following: TOGAF, Archimate, technical and professional communication, enterprise architecture, data curation.

Benefit Eligibility
This position is eligible for University benefits. The University offers a comprehensive benefits package, including medical, dental and vision plans, retirement, paid time off, and educational fee discounts. For additional information on University benefits, please visit the Faculty & Staff Benefits website at http://www.umsystem.edu/totalrewards/benefits

Equal Employment Opportunity

The University of Missouri is an equal access, equal opportunity, affirmative action employer that is fully committed to achieving a diverse faculty and staff. For more information, call the Associate Vice Chancellor of Human Resource Services/Affirmative Action officer at 573-882-4256.

To request ADA accommodations, please call Human Resource Services at 573-882-7976. TTY users, please call through Relay Missouri, 1-800-RELAY (735-2966) or en Español at 1-800-520-7309.

Building an EA maturity model in SharePoint

In this post, I’ll explain how you can easily set up a EA maturity model in SharePoint. In this example, I’ll be using the GAO’s Framework for Assessing and Improving Enterprise Architecture Management (version 2.0). In this post I’ll assume you already understand why you need a maturity model (which I could over in another post if folks are interested…).

Clearly, how a maturity model is structured will impact how you have to set up your SharePoint site to create the model. However, I believe you can take what I present here and easily adopt it whatever model you use (especially the maturity stage setup).

1. Understanding the structure

The GAO’s maturity model stipulates 59 core elements which are the collective practices, structures, activities, and conditions that can permit the organization to progress to increasing higher states of EA management.

The GAO further organizes these 59 core elements by 4 sets of characteristics critical to the successful performance of a program. The GAO model actually has more than one way to categorize by 4 characteristics — each way a unique way to represent an organization. In this example, we’ll be using the “EA Enabler Representation of Core Elements”.  This representation reflects four critical enablers or types of resources within any organization that can be leveraged to effect change. These four categories are; leadership, people (or staff), processes, and tools. In other words, each of the 59 core elements have to do with either something leadership must do, people you must have, processes you must have in place, or tools you must have in order to achieve a certain maturity level of EA program.

The GAO designates a 7 stage maturity model (stages 0 – 6). Each of the 59 core elements are found in one of those 7 stages.

Since we’re going to be showing progress through this maturity model, we’ll need to further track the progress we make in these of these core elements as well as any running commentary as we work on these core elements.

It will be easiest to build this maturity model as a set of lists.

2. Building the lists

The maturity model will be composed of 2 lists:

EA Core elements: this list stores the core elements, their description, any actions we’ve taken on them and their status. (You’ll also note in this example that we have a color coded image to show a sort of dashboard of status. However, I’ve never made alot of use of this, so you can just ignore it).

EA Maturity: the main list you’ll see. This list contains the core element (looked up from the ‘EA Core elements’ list),  the category of critical success category into which the core element fits, and what maturity stage the core element would be found.

You could possibly put the critical success category into the EA Core elements list, but at the time I was building my model, I wanted to keep the option of using other groupings that the GAO model provides. Either way, I don’t think it will affect how you use this model.

Because the ‘EA Maturity’ list will look up values from the EA Core elements list, let’s create the core elements list first.

I won’t go into the details of how to build lists. There are plenty of good tutorials on how to do that. Instead, I’ll simply show you the key properties of these lists.

3. The EA Core elements list

First the EA Core elements list is created with the properties shown in the image below.

20140526-eacore1

Properties of EA Core elements

These are straightforward. The name of the core element and its description will go into the item and description fields. Actions taken will go into the actions field and the status will be a single line of text. (It would be better to have the status as a look up. However, that created difficulties later in development. So for now you’d need to type in a status such as ‘not started’, ‘in progress’, or ‘completed’.)

So that actions can record a running record of what you’ve done for each core element, you’ll want to make sure this field is set for appending changes to existing text. (You’ll probably also want to set it for enhanced rich text if you want to use any sort of tables in your documentation. I know I have.) You can see the settings for actions in this figure.

20140526-actions

Settings for actions field

At this point you can begin entering the core elements found in the GAO maturity model. To make things easier, you can find them all listed in Appendix II of the PDF linked at the beginning of this article.

4. The EA Maturity list

The fields used in the EA Maturity list are shown below.

properties of EA maturity

Properties of the EA maturity list

The item field isn’t used so it will remain empty. The critical success attribute is a choice field (leadership, people, processes, tools). The maturity field is also a choice list. You could just have choices of 0 through 6. However, for reasons that will become apparent later, you’ll want the choices for the maturity rating to be more description. So instead of ‘1’, you’ll enter ‘Stage 1: Establishing EA institutional committment and direction’.

The next three fields are linked to the EA core elements list. The first is the actual core element is a look up. The next core element field is a column set to populate when the previous field is selected. The status column is also automatically linked when the core element is selected. Why two core element fields? the second linked on is a link to the item in the original core element list. This means that if you click on that field, you’ll open a model window that shows you the details of that core element.

Again, I won’t go into the details of how to build links to look ups, but here is what the relevant properties are as you build the look up for the core element linked to the original record.

20140526-lookup

Adding a column based on the look up value of core element

Now you are ready to go through the GAO model (pages 37 – 39) and create a new record in EA Maturity that lists the maturity level, the core element associated (from look up) and the critical success attribute to which it belongs.

5. EA Maturity: Creating the view

Setting the appropriate view is what helps this model present your case for what has been done in your program and what still remains to be done to mature your EA program.

You’ll want your default view to show ‘Core element: Status, Core element, and Critical Success Attribute in that order of columns.

Furthermore, you’ll want the view to group by the Maturity field in ascending order. You may or may not want to set an item limit (I set mine to 30). You can choose to set the groupings expanded by default.

If you’ve set these lists up correctly, you’ll have a functional EA maturity model that can be easily updated. The image below shows the model with stage 1 collapsed and stage 2 open. You can quickly see which core elements are in progress and which have had no action yet. You can also see what type of core elements they are (e.g., tools, leadership, etc.)

View of stage 2 maturity

View of stage 2 maturity

If you need to explain all the process related activities which must occur to achieve a fully matured EA program, you can click on the critical success attribute column and filter by ‘process’.

EA maturity filtered by processes

EA maturity filtered by processes

A click on any of the core elements opens a model window showing that the core element, its description and a running tally of status updates.

Detail of a core element

Detail of a core element

I hope this is of help to those of you leveraging SharePoint in your EA program.